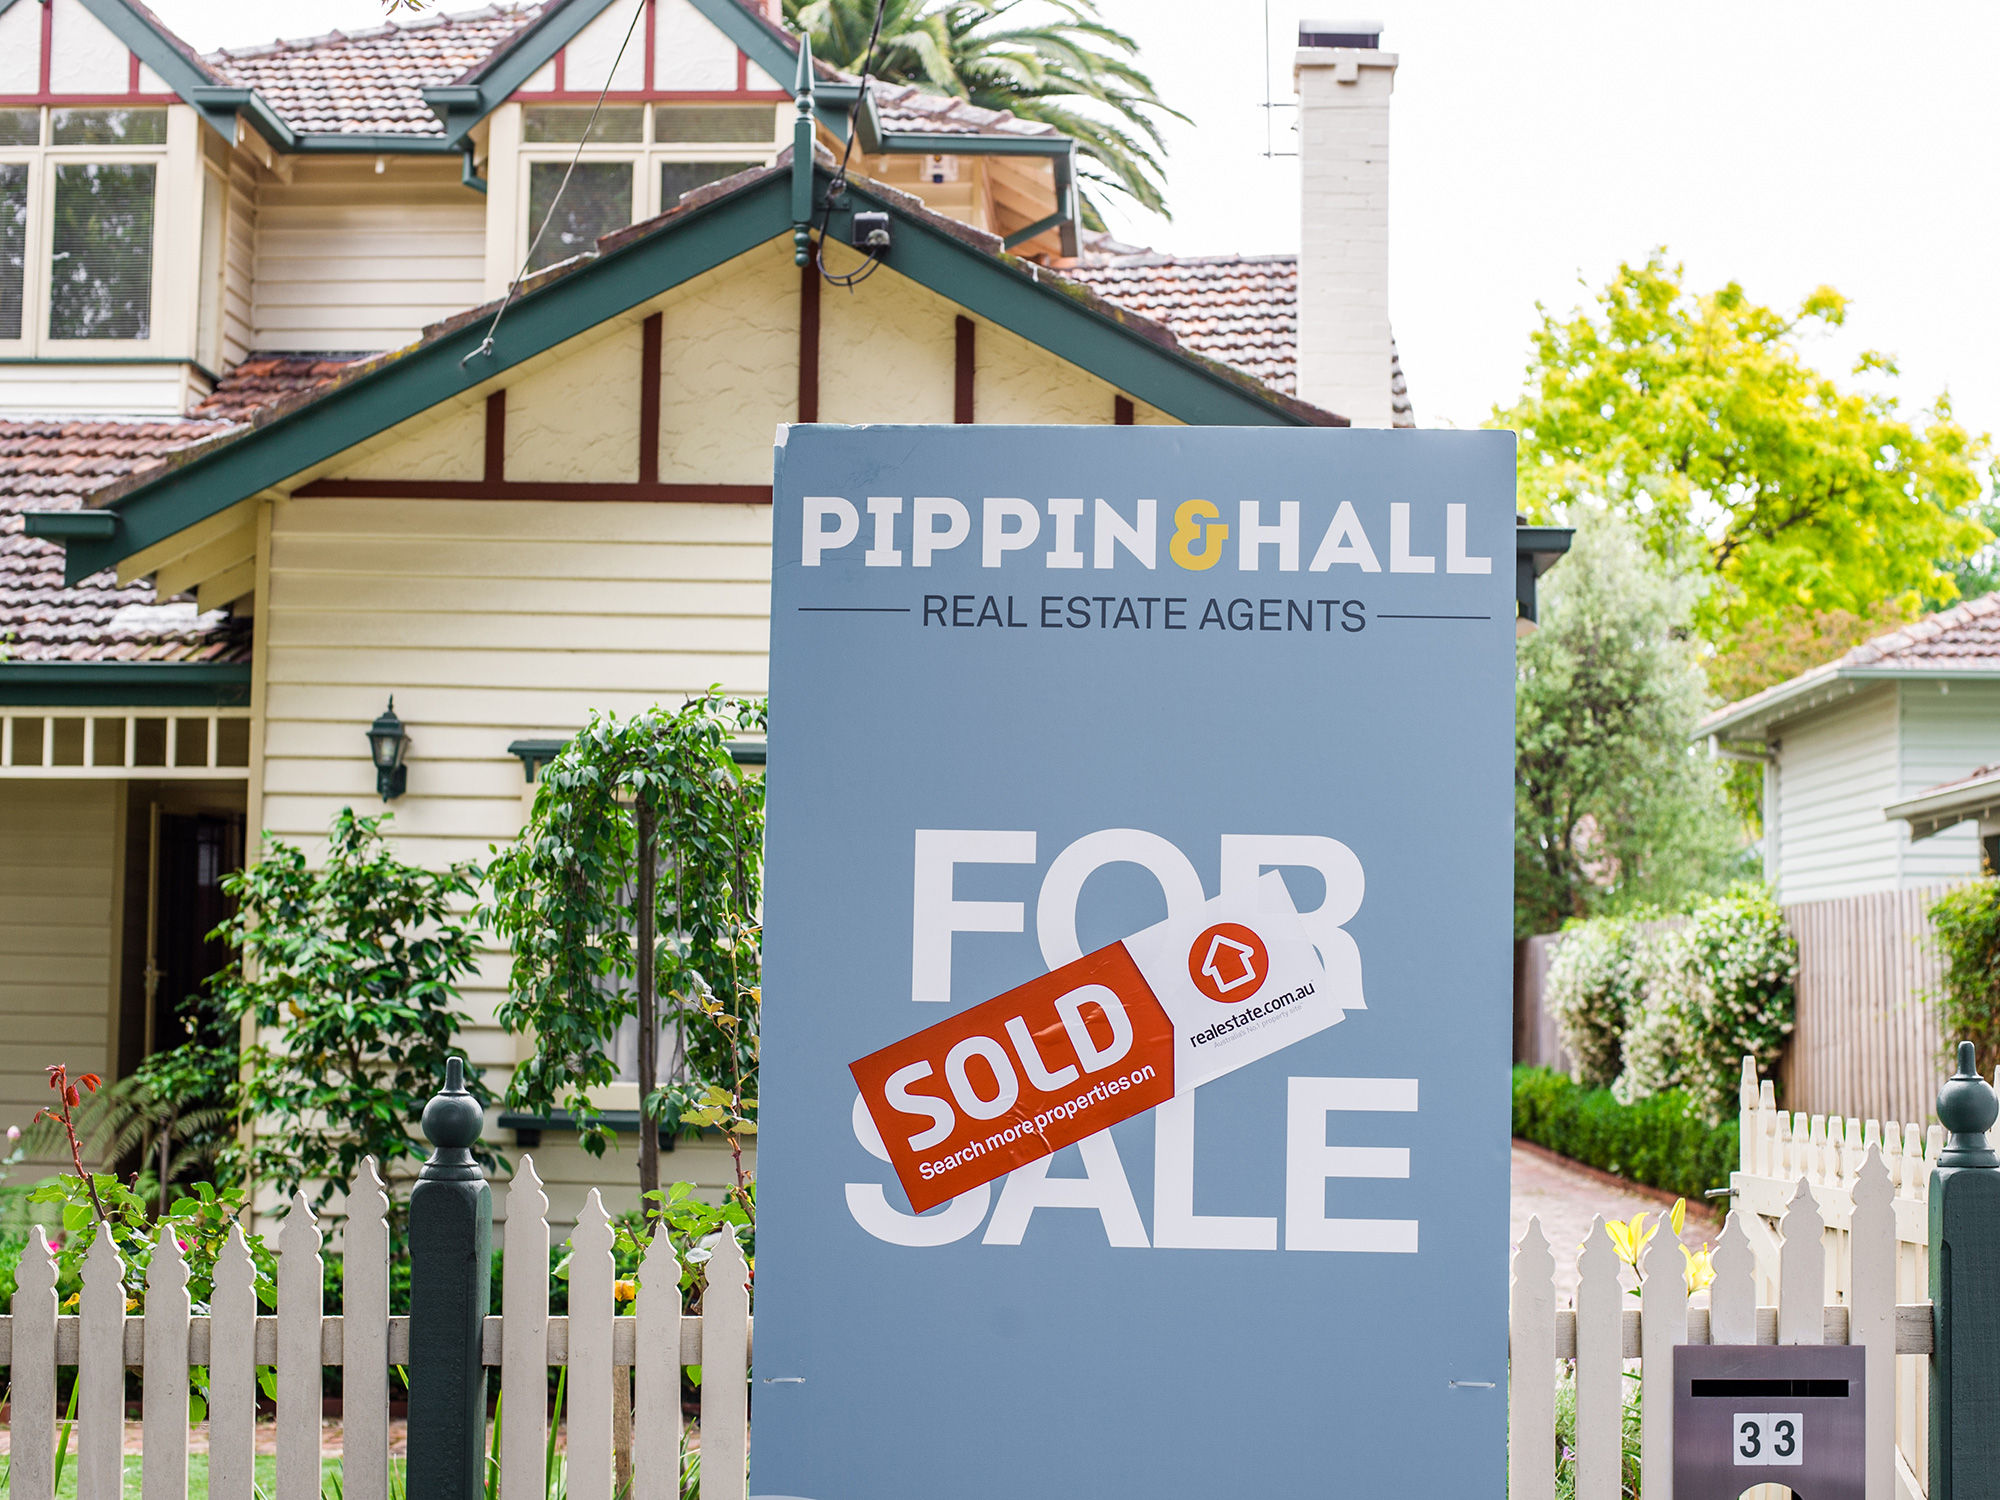
Homes in Australia’s hottest suburbs have boomed in value by as much as 680 per cent over the last two decades – underlying the belief in the Great Australian dream of property ownership.
Homes in Australia’s hottest suburbs have boomed in value by as much as 680 per cent over the last two decades – underlying the belief in the Great Australian dream of property ownership.
 Property data compiled by realestate.com.au illustrates the tremendous capital growth savvy, and in some instances lucky, home buyers have enjoyed in the years between the Sydney Olympics and the COVID-19 pandemic in metropolitan areas.
The spread of the suburbs and even regions that have enjoyed such unprecedented capital growth cover a variety of terrain, from exclusive enclaves to the gentrified inner city, through the metropolitan ring suburbs and to the bucolic surrounds beyond.
In lists compiled of the biggest growth suburbs of the last 20 years in Adelaide, Brisbane, Sydney and Melbourne those who owned or bought property at the turn of the millennium and have kept it, have cashed in big time.
From Harrington Park in Sydney’s south-west whose median house price has skyrocketed from $148,000 to $960,000 over the last 20 years for an incredible capital growth of 549 per cent, to Kilburn in Adelaide’s inner north where home values have leapt 683 per cent from $55,000 to $434,400.
Then there’s Windsor in Brisbane’s inner north which had grown 492 per cent from it’s median value of $183,000 in 2000. And in Melbourne, Tyabb on the Mornington Peninsula has led the way with average house prices growing 682 per cent from $121,5000 to $950,000.
Kilburn and Windor have illustrated the growing demand for inner city living in that time, while Harrington Park and Tyabb are evidence of growth of Australia’s two biggest cities into areas that were formerly rural.
 Realestate.com.au chief economist Nerida Conisbee said suburbs that had undergone urban renewal or become substantially more desirable because of a shift in buyer preferences had recorded strong price growth.
“Twenty years ago, it wasn’t as popular to live so close to the beach,” Ms Conisbee said.
“People also wanted bigger homes on big blocks and wanted to live further out, but there’s been a real shift towards wanting to live close to amenities and to be within walking distance of everything.”
Ms Conisbee said the gentrification of certain suburbs had also created a ripple effect, which pushed up prices in neighbouring suburbs.
“A lot of old people have moved out of these suburbs in the past 20 years and a lot of younger people have moved in,” she said.
“Because young people tend to renovate and demand better services, that gives a lot of areas renewed energy, which tends to lead to some big changes in prices.”
At the other end of the list of the best performing 100 suburbs, but by no means the poor cousin sits inner city Elsternwick in Melbourne, where average house prices have moved from $397,000 in 2000 to today’s median of $1,927,500, an increase of 386 per cent. In Prestons, very much in the geographic heart of Sydney, prices have moved up by 281 per cent from $193,000 to $735,500.
In Brisbane, the former freehold settlement of Logan Village sits at the bottom of the top 100 suburbs, having grown 289 per cent from a median of $158,000 to $615,000. And in Adelaide’s centre Old Reynella, named after an early South Australian winemaker has jumped 251 per cent from a media of $114,000 to $400,000.
 Top 10 growth suburbs over the last 20 years (median house prices)
Adelaide
1. Kilburn: $55,500 to $434,400 (683%)
2. Greenacres $85,400 to $462,500 (442%)
3, Northfield $85,000 to $447,000 (426%)
4. Blair Athol $97,500 to $500,000 (413%)
5. Windsor Gardens $96,000 to $477,500 (397%)
6. Clearview $90,000 to $447,500 (397%)
7. Henley Beach $201,000 to $940,000 (368%)
8. Willunga $125,000 to $582,500 (366%)
9. Rosewater $84,000 to $389,000 (363%)
10. Christies Beach $80,000 to $365,500 (357%)
Brisbane
1. Windsor $183,000 to $1,082,500 (492%)
2. Bulimba $240,000 to $1,395,000 (481%)
3. Coorparoo $185,000 to $1,050,000 (468%)
4. Grange $206,000 to $1,160,000 (463%)
5. Sandgate $140,000 to $782,500 (459%)
6. Salisbury $115,000 to $625,000 (443%)
7. New Farm $295,000 to $1,600,000 (442%)
8. Rocklea $76,500to $408,000 (433%)
9. Hawthorne $265,000 to $1,410,000 (432%)
10 Deagon $91,000 $480,000 (427%)
Sydney
1. Harrington Park $148,000 to $960,000 (549%)
2. Currans Hill $96,000 to $605,000 (530%)
3. Hamlyn Terrace $101,500 to $618,000 (509%)
4. Rouse Hill $164,000 to $938,000 (472%)
5. Beaumont Hills $207,000 to $1,158,000 (459%)
6. West Hoxton $159,250 to $835,000 (424%)
7. Canley Vale $168,000 to $830,500 (394%)
8. Lisarow $150,000 to $725,000 (383%)
9. Erina $180,000 to $857,500 (376%)
10. North Bondi $600,000 to $2,850,000 (375%)
Melbourne
1. Tyabb $121,500 to $950,000 (682%)
2. Somers $144,000 to $970,051 (574%)
3. Clayton $182,000 to $1,200,500 (560%)
4. Springvale $125,000 to $762,000 (510%)
5. Malvern $465,000 to $2,800,000 (502%)
6. Box Hill $270,000 to $1,623,500 (501%)
7. Mont Albert North $263,000 to $1,540,500 (486%)
8. Crib Point $90,000 to $525,000 (483%)
9. Rye $121,000 to $702,500 (481%)
10 Tootgarook $104,000 to $600,000 (477%)
Source: news.com.au


